Debugging Elixir Code: The Definitive Guide

Every application contains bugs, and even if it doesn't, it will.
Even if you're not a notorious bug producer and your code quality is generally good, the conditions programmers work in are often suboptimal - you will often find yourself pulling your hair out over code written years ago by someone no longer involved in your project.
In this article, you will find out what approaches and tools are efficient in debugging Elixir applications - often contrary to popular beliefs within the community. Before I jump in to the meaty part, though, let me do a more personal introduction about debugging in general - finding the right mindset to do the thing, and how you can benefit from being a debugging expert.
Debugging is an art
Whenever I tutor junior programmers, I stress that the ability to think analytically about what can go wrong in the code you work on and the courage to tinker around are major traits that distinguish a great programmer from a good one.
This is not something you'll learn in an online course, or a bootcamp, or even at universities - it's down to your personal determination and the experience you earn while gaining practice - be it commercial work or any project you undertake.
I learnt a lot by debugging my own code as well as others' work in projects I worked for, and also - which is something many programmers would often not do by default - digging into and analyzing library code.
I like thinking about debugging tools as something that should get out of your way - when you've got an idea on how to go about dealing with a specific issue, a good debugging toolset is something that just works and doesn't require babysitting to get it right.
Is it the case with what Elixir and Erlang/OTP have to offer? Well, as of 2021, the answer is rather ambiguous. I will show you a number of tools that you can use - and you'll see clearly that all of those have their strengths and weaknesses, which mean that you probably won't find a single tool that suits all needs and applications. But when you're aware of how they work, they surely will be hugely helpful for you.
Being naive: IO.inspect/2
Have you ever debugged your [JS app using](https://curiosum.com/til/check-if-set-contains-values-in-jest-js) console.log, or your C app using puts and the like? The IO.inspect/2 function is little more than this - with some small caveats that make it a bit more useful in a functional programming context.
Debugging apps by printing diagnostic statements to the console is something everyone does to some extent. Some developers will be happy with raw printing functions such as IO.puts/1, others will prefer to keep diagnostic data organized straight from the start using Logger. But IO.inspect/2 is something quite unique to Elixir and pretty much in line with the language's smartness.
IO.inspect/2 takes literally anything as its first argument and an opts keyword list as the second, and while we won't be talking much about the second one which is optional and helps format the output to your liking, let's think of it as an IO.puts on steroids:
- it uses
Kernel.inspect/2to convert any value to a printable string, - it returns the first passed argument so it can be used in pipelines with the
|>operator.
For example, let's have a look at this snippet:
foo = fn %{} = input ->
  input
  |> Map.put(:bar, "Lorem ipsum...")
  |> Map.put(:baz, "...dolor sit amet")
  |> Map.merge(%{fizz: "buzz"})
end
Oftentimes Elixir functions will come as a single pipeline expression like this - it's a good pattern to avoid writing procedural code with consecutive variable assignments.
Let's assume that we would like to analyze the pipeline and peek at what's somewhere in between the pipeline's steps, for example after Map.put(:bar, "Lorem ipsum..."). Since the return value of that expression is passed on to the next step as its first argument, it's of special interest to us.
Thanks to its traits, IO.inspect/2 comes to the rescue:
foo = fn %{} = input ->
  input
  |> Map.put(:bar, "Lorem ipsum...")
  |> IO.inspect()
  |> Map.put(:baz, "...dolor sit amet")
  |> Map.merge(%{fizz: "buzz"})
end
Evaluating foo.(%{key: "val"}) in IEx will result in the following:
%{bar: "Lorem ipsum...", key: "val"} # printed out to the console when IO.inspect is used
%{bar: "Lorem ipsum...", baz: "...dolor sit amet", fizz: "buzz", key: "val"} # return value of the foo function
That's it. Is it any good? Certainly. Is it good enough for all applications? Some people argue that they don't need anything else. Personally I think it's good for inspecting code that's generally well-written, using the pipeline pattern extensively and easy to have a look at. It's also very good for diagnosing code that can't really take being interrupted, e.g. when things happen in parallel between some processes.
On the other hand, though, I find it hard to follow any kind of diagnostic logging - be it puts,inspect orLogger usage - in a sea of the Phoenix development server's output which often includes lengthy SQL query logging. It's also good when you know exactly what output you'd like to see and analyse, but if you're new to a piece of code, and a function's argument names are unclear to you, and you don't know what you can interact with at that particular context so you'd like to sit down for a moment and try out different things, you would need to turn to more sophisticated tools that provide interaction at a given breakpoint.
That's why this is the naive approach. Let's move on to the more professional ones.
Being professional: IEx
IEx is Elixir's interactive shell that you normally use to evaluate expressions interactively, as in every other language's REPL tool. I won't be discussing all of its abilities here - it's got everything you need to use the language interactively.
In a nutshell: for debugging purposes, IEx allows the developer to:
pryinto the process environment at a given code line so you can interact with the context,break!in a function to set a breakpoint when it's executed one or more times.
Pry
If you're coming from a Ruby background, chances are that you're aware of the pry gem providing an improved interactive shell, and its binding.pry method, allowing the programmer to literally "pry" into code by inserting a statement that adds a breakpoint at a given code line.
Given the overlap between Ruby and Elixir communities, it's no surprise that the idea of "prying" into the code was brought over.
Here's a basic example. You can create a file named pry.exs in any folder and execute it using iex pry.exs (you don't need to create a Mix project for that - but if you wanted to execute such a file in the context of a Mix project directory, you'd do iex -S mix run pry.exs ):
defmodule PryTest do
  # Notice that requiring IEx is mandatory for you to call IEx.pry/0
  # as it is a macro. Also, you must use `iex` and not `elixir` to run
  # the script since Pry requires the IEx shell to be running.
  require IEx

  def perform(argument) do
    variable = 2
    IEx.pry()
    private_result = private_function(variable + argument)

    intermediate_result = private_result + 1
    intermediate_result + 1
  end

  def public_function(argument) do
    argument * 2
  end

  defp private_function(argument) do
    IEx.pry()

    argument + 1
  end
end
When you execute the file, you're going to see this:
Request to pry #PID<0.106.0> at PryTest.perform/1 (elixir-debugging/pry.exs:6)

    4:   def perform(argument) do
    5:     variable = 2
    6:     IEx.pry()
    7:     private_result = private_function(variable + argument)
    8:

Allow? [Yn]
After hitting Return to confirm that you allow interacting with the breakpoint, you have a chance to peek into current function arguments, variables and everything which is available in the current context (called binding and available via Kernel.binding/0 ). You can also call every module's (including current function's module) public functions, but you cannot call its private functions - which is a drawback you need to be aware of.
# Reads out an argument or a variable:
pry(1)> argument
1
pry(2)> variable
2

# Shows all variables available in the current context:
pry(3)> binding()
[argument: 1, variable: 2]

# Calls a public function of the current module (note that __MODULE__
# denoting the current module is necessary). Will not call a private
# function even though it's in the same module!
pry(4)> __MODULE__.public_function(argument)
2
pry(5)> __MODULE__.private_function(argument)
** (UndefinedFunctionError) function PryTest.private_function/1 is undefined or private
    PryTest.private_function(1)

# Calls a public function of a different module - regardless of whether
# it's built into Elixir or it's part of your compiled app.
pry(5)> Enum.map([1, 2, 3], &(&1 + argument))
[2, 3, 4]

# If you've just run a costly computation and somehow forgot to put it
# into a variable, don't worry - use the `v/0` helper to retrieve the last
# returned value or call `v/1` to retrieve the n-th last value.
pry(6)> v
[2, 3, 4]

# If you've lost yourself, you can peek into where you currently are
# and see your backtrace.
pry(7)> whereami
Location: elixir-debugging/pry.exs:6

    4:   def perform(argument) do
    5:     variable = 2
    6:     IEx.pry()
    7:     private_result = private_function(variable + argument)
    8:

    elixir-debugging/pry.exs:6: PryTest.perform/1
    elixir-debugging/pry.exs:24: (file)
    (elixir 1.11.4) src/elixir_compiler.erl:75: :elixir_compiler.dispatch/4
    (elixir 1.11.4) src/elixir_compiler.erl:60: :elixir_compiler.compile/3
    (elixir 1.11.4) src/elixir_lexical.erl:15: :elixir_lexical.run/3
    (elixir 1.11.4) src/elixir_compiler.erl:18: :elixir_compiler.quoted/3

# To move on, use the `continue/0` helper. This will continue the app's
# execution until a next breakpoint is hit.
pry(18)> continue
Break reached: PryTest.private_function/1 (elixir-debugging/pry.exs:18)

   16:
   17:   defp private_function(argument) do
   18:     IEx.pry()
   19:
   20:     argument + 1
As you can see, you can navigate in your code pretty efficiently using IEx.pry() . Relying solely on approach has important drawbacks:
- You can't move between lines of code using commands known in other languages as
Step Over,Step Into,Step Out- as Jose Valim said, Pry is not really a debugger but a tool allowing to interact with a particular context. - To insert breakpoints in your code, you need to recompile it - which is often time-consuming in larger projects.
- You can't "pry" into a function in a module that's already compiled - which means you won't be able to debug library code using it.
To make your life easier, though, there's another tool in IEx to help you out...
Break
The break!/4 helper allows you to programmatically set a breakpoint on entry into a given function - regardless of whether it's built-in, or in a library, or in your own application code.
This time, you'll have to create a file within a Mix project because break! must operate on compiled modules, not .exs scripts. Suppose that you have an Elixir app generated with mix new break_test . In lib/hello.ex , there's a generated BreakTest.hello/0 function. Run the app with iex -S mix to have your app running along with the IEx shell and try it out.
# lib/break_test.ex

defmodule BreakTest do
  def hello do
    :world
  end
end

# Your IEx console

# This means: Break into `BreakTest.hello/0` on two next calls of
# the function (the last argument is optional - if not given, the break
# will only kick in *once*.
iex(1)> break! BreakTest, :hello, 0, 2
2
iex(2)> BreakTest.hello
Break reached: BreakTest.hello/0 (lib/break_test.ex:15)

   13:
   14:   """
   15:   def hello do
   16:     :world
   17:   end

pry(1)> continue
:world

Interactive Elixir (1.12.0) - press Ctrl+C to exit (type h() ENTER for help)
iex(1)> BreakTest.hello
Break reached: BreakTest.hello/0 (lib/break_test.ex:15)

   13:
   14:   """
   15:   def hello do
   16:     :world
   17:   end

pry(1)> continue
:world

Interactive Elixir (1.12.0) - press Ctrl+C to exit (type h() ENTER for help)
iex(1)> BreakTest.hello
:world
This way, you can interact with both your own code and library code just like using IEx.pry/0 - here's an example from Timex :
iex(1)> break! Timex, :local, 0
1
iex(2)> Timex.local()
Break reached: Timex.local/0 (deps/timex/lib/timex.ex:90)

   88:   """
   89:   @spec local() :: DateTime.t() | {:error, term}
   90:   def local() do
   91:     with tz when is_binary(tz) <- Timezone.Local.lookup(),
   92:          {:ok, datetime} <- DateTime.now(tz, Timex.Timezone.Database) do
Sometimes you'll end up trying to debug a function called via macro expansion, such as using defdelegate or, very commonly, use . Unfortunately you won't quite get into the part of the codebase where the bulk of the function's definition was, since after the macro expansion phase IEx cannot track it back. This is a drawback common to all debugging tools in Elixir, and it's interesting whether the compiler will ever be able to handle it in a slightly smarter way.
pry(1)> break! Timex, :now, 0
2
pry(2)> Timex.now()
Break reached: Timex.now/0 (deps/timex/lib/timex.ex:63)

   61:   """
   62:   @spec now() :: DateTime.t()
   63:   defdelegate now(), to: DateTime, as: :utc_now
   64:
   65:   @doc """
You can even break into functions from built-in modules. However, most Elixir builds lack source code data for built-in functions, which means you'll end up like this:
iex(2)> URI.encode("Hello World")
Break reached: URI.encode/1 (/home/build/elixir/lib/elixir/lib/uri.ex:366)
pry(1)> binding
[x0: "Hello World"]
pry(2)> x0
"Hello World"
pry(3)> continue
"Hello%20World"
Summing up - break! is good for:
- debugging library code
- prying into private functions
- analysing convoluted codebases that take very long to compile
- inserting breakpoints programmatically from within the code - for instance, when you'd like to conditionally insert a breakpoint when something happens with the app running in your development environment, you can call
IEx.break!/4from the application code
The most evident disadvantage of this tool is that it doesn't allow you to break into a given line in a function - you can only get at its very beginning.
Debugging pipelines
It's a good practice to avoid writing code in a variable-heavy style and go for Elixir's pipe operator to make your code more idiomatically functional.
I used to often find myself in a situation when there's an expression written using the |> operator that I want to debug - and I want to peek into somewhere in the middle of that pipeline. I would most often use IO.inspect for that, because it's got the convenient trait of returning its argument so it can just be plugged into the pipe.
"string"
|> String.reverse()
|> IO.inspect() # prints out: "gnirts"
|> String.upcase()
# expression returns "GNIRTS"
What if I wanted to use pry to have a deeper interaction with the context? I would have to break it into two separate expressions with variable assignments, which wouldn't make my life easier and would be hard to revert.
v1 =
  "string"
  |> String.reverse()

IEx.pry()

v1
|> String.upcase()
I thought about this for some time, and came to the conclusion that I can use the inconvenience of not being able to pry into the code of functions called via macro expansion to my advantage.
Let's start from the assumption that we can inline an anonymous function into the pipeline and execute it right away - and then we can IEx.pry in it, having access to the argument that will be passed to the next function.
# lib/break_test.ex
defmodule BreakTest do
  require IEx

  def hello do
    "string"
    |> String.reverse()
    |> (fn arg ->
      IEx.pry()
      arg
    end).()
    |> String.upcase()
  end
end

# IEx console

iex(1)> BreakTest.hello()
Break reached: BreakTest.hello/0 (lib/break_test.ex:8)

    6:     |> String.reverse()
    7:     |> (fn arg ->
    8:       IEx.pry()
    9:       arg
   10:     end).()

pry(1)> arg
"gnirts"
We now have access to the value returned by String.reverse/1 at line 6. Since - as we've already seen - when debugging functions called via macro expansion we will see the place where the uppermost macro call was made, we can create a macro that is equivalent to putting this anonymous function into the pipeline.
Because of macro hygiene, to make arg accessible whenever we use BetterPry.peek/1 to inspect the argument returned by the previous function,
# lib/better_pry.ex
defmodule BetterPry do
  defmacro peek(arg) do
    quote do
      require IEx # ensure we can use pry
      var!(peek_arg) = unquote(arg) # circumvent macro hygiene - "expose" peek_arg variable
      IEx.pry()
      unquote(arg) # actually return the original "arg"
    end
  end
end
Then, we can use BetterPry.peek to expose an intermediate result in a pipeline as pipe_arg :
# lib/break_test.ex
defmodule BreakTest do
  require BetterPry

  def hello do
    "string"
    |> String.reverse()
    |> BetterPry.peek()
    |> String.upcase()
  end
end

# IEx console

iex(1)> BreakTest.hello()
Break reached: BreakTest.hello/0 (lib/break_test.ex:7)

    5:     "string"
    6:     |> String.reverse()
    7:     |> BetterPry.peek()
    8:     |> String.upcase()
    9:   end

pry(1)> peek_arg
"gnirts"
I encourage you to try it out! You might find out that debugging pipelines is much easier when you can actually pry into them.
Debugging Phoenix apps: Battling Timeouts
Oftentimes, when using pry in Phoenix applications, you will find yourself face the problem of the request you're debugging being automatically cancelled after 60 seconds of waiting for the connection to provide a result - the TCP connection is automatically closed.
You can handle it, though, by setting the idle_timeout option in your app's Endpoint configuration in config/dev.exs . Your cowboy version needs to be locked at at least 2.x to be able to do this.
config :hello, HelloWeb.Endpoint,
  http: [port: 4000, protocol_options: [idle_timeout: 5_000_000]],
  # ...
Another important aspect is using debugging tools in tests - there's a default 60-second timeout in ExUnit itself, as well as something named ownership_timeout of a PostgreSQL connection.
To tackle both of those, go to your test/test_helper.exs file and configure the timeout before starting tests:
ExUnit.configure(timeout: :infinity) # or whatever you need
ExUnit.start()
...and increase the ownership timeout in config/test.exs :
config :hello, Hello.Repo,
  # ...,
  ownership_timeout: 999_999_999
There you go - you've got rid of this annoying issue!
Erlang debugging: Real debugger, clumsy usage
One last thing I'd like to mention is that apart from IEx, which is an Elixir-specific tool, there is also Erlang's built-in debugger which is a fully-fledged debugging tool - in contrast to pry and break , you can navigate in the code by stepping in, out and over.
A major problem with using Erlang debugger in Elixir code is that, well, it's not an Elixir debugger, and it's a separate tool that you have to launch - there's a caveat to that, but we'll get back to it later.
To run the debugger in Windows using WSL2, you need to take some additional steps (described here and here) - Mac or Linux users will find it much easier.
Open up your project - use iex -S mix phx.server if it's a Phoenix app, or iex -S mix in a pure Mix project. Essentially IEx is not important here for debugging purposes, because we're using Erlang toolset instead of Elixir's shell now for debugging - we're only using IEx to open up the debugger and test out breakpoints.
Then, call :debugger.start() - you should see a window like this.
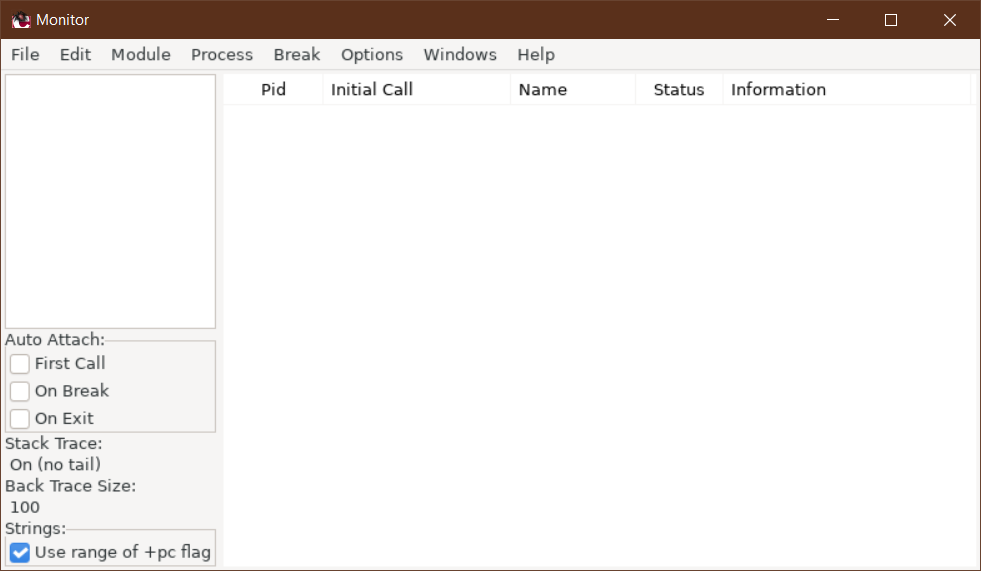
Then call :int.ni(BreakTest) to ensure the BreakTest module is interpreted, which is a prerequisite for us being able to debug its functions.
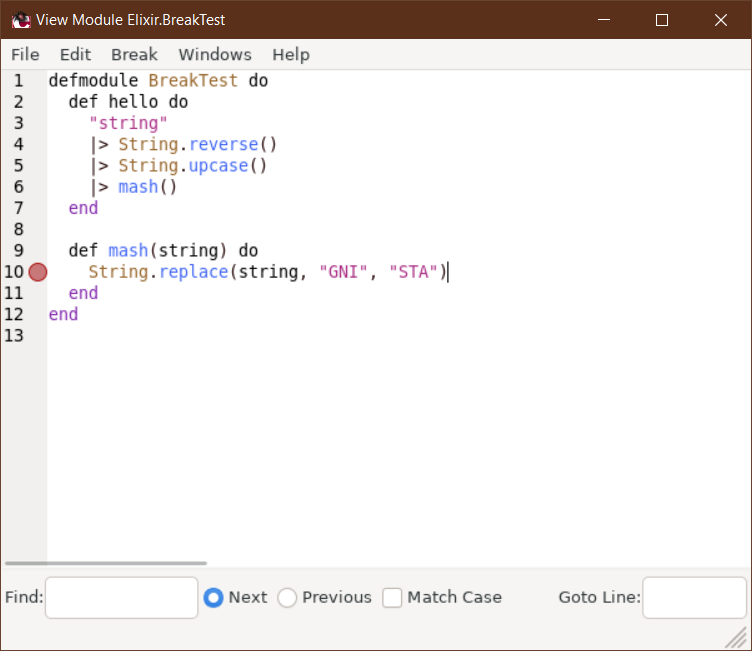
Now, click Module → Elixir.BreakTest → View to inspect the module's source code. Double-clicking a line sets or unsets a breakpoint on it.
Executing BreakTest.hello/0 causes the process to interrupt - we're now at line 10 of this file. Double-click on the "break" entry corresponding to this module in the debugger's main window and you'll see the debugger in action.
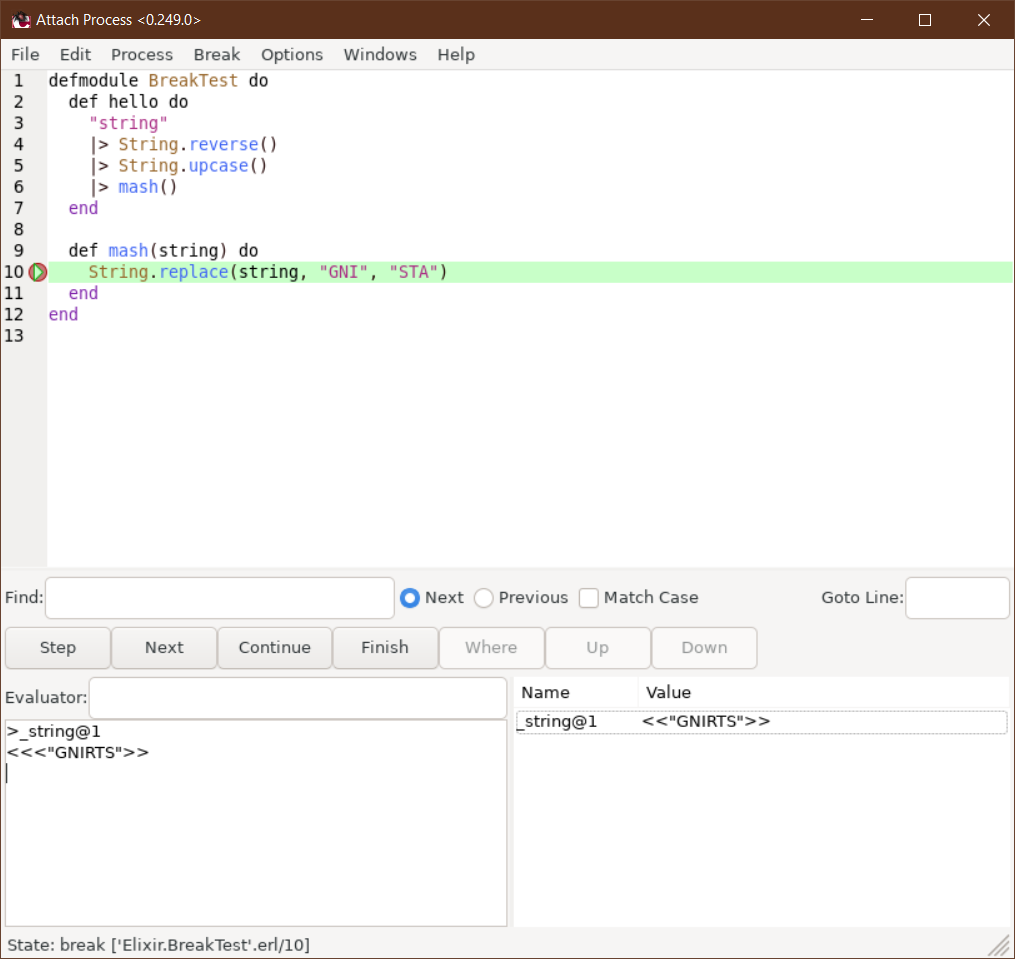
You can evaluate expressions, but it's unfortunately not evaluated in Elixir - so it's rather inconvenient for this purpose. But the entire binding is accessible in the window, and you can step over, into and out of a specific line of code, which is better than in IEx.
Clearly, you can see that it's not a particularly convenient tool for Elixir code. It can, however, come in handy at times - when the most important aspect is being able to navigate between code lines and stepping up or down the stack trace.
Visual Studio Code & ElixirLS
Likely the most popular code editor among [Elixir programmers](https://curiosum.com/blog/story-of-elixir-programming-language), Visual Studio Code has a whole lot of extensions - the most important of which for us is ElixirLS, which provides language server integration between the editor and Elixir for IntelliSense, auto-completion, Dialyzer integration, warning and error reporting and - of course - debugging capabilities.
Inside your Mix project, enter the "Run and Debug" tab in the sidebar and click the "cog" icon in the "Run and Debug" section. A launch.json file will be created in your project's directory - for the purpose of a vanilla Mix project you can leave it in its default form, whereas for Phoenix applications you should add "task": "phx.server" to the default task definition.
This isn't important for Phoenix apps, but a vanilla Mix project needs an "entry point" of the application so it runs some code at startup - define a module that calls the BreakTest.Hello function and reference it in the mix.exs file:
# lib/break_test/application.ex
defmodule BreakTest.Application do
  use Application

  def start(_type, _args) do
    BreakTest.hello()
    {:ok, self()}
  end
end

# mix.exs
defmodule BreakTest.MixProject do
  # ...
    def application do
    [
      mod: {BreakTest.Application, []},
      # ...
    ]
  end
end
Afterwards, hit the green "Start Debugging" button next to the "cog" icon.
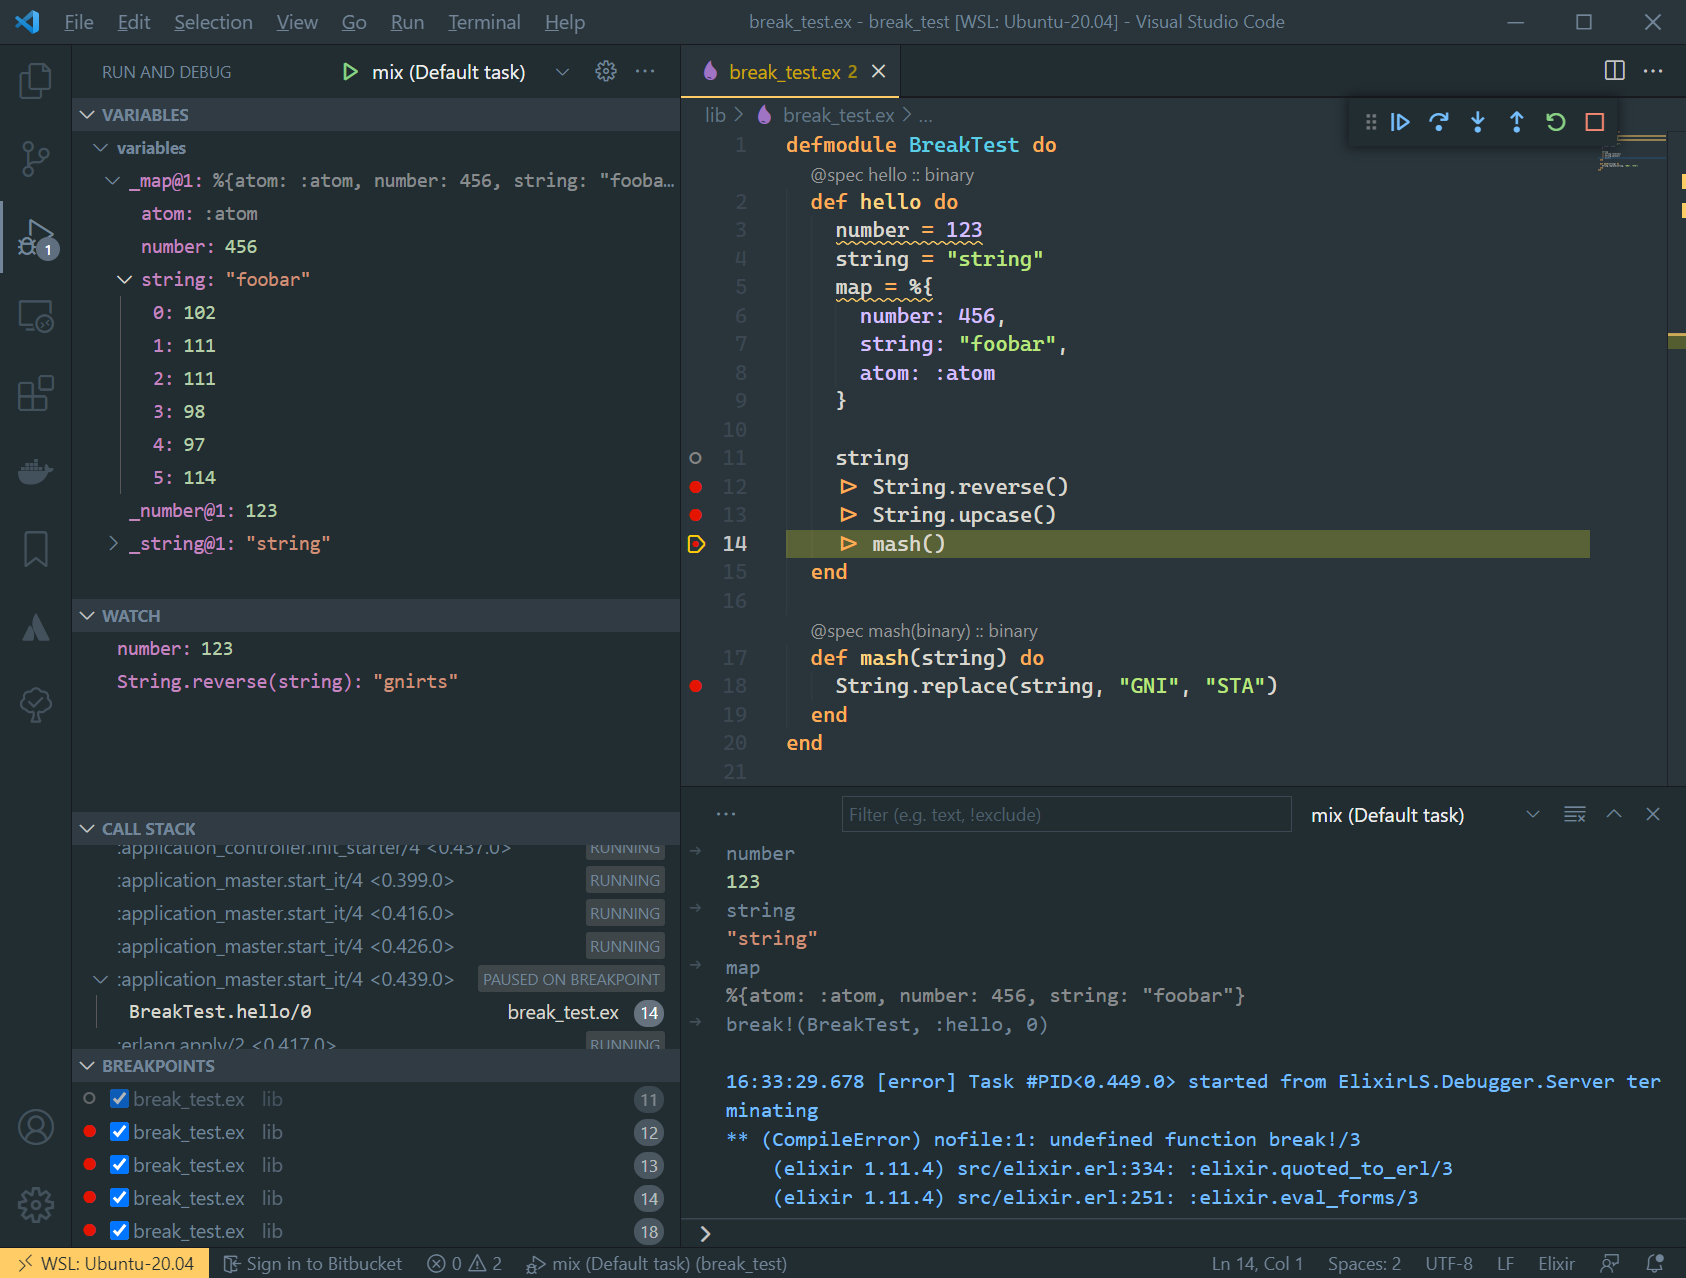
The icons in the top-right corner toolbar, in their particular order, denote:
- continue execution,
- step over (go to the next line of code),
- step into (i.e. dig deeper into the next function call)
- step out (i.e. move up the stack trace)
- recompile the project
- stop the virtual machine
On the left hand side of the screen, you can see:
- Variables (current binding displayed in a nice tabular way)
- Watch (allowing you to watch custom expressions when a breakpoint is encountered - for instance, evaluating functions)
- Call stack of every OTP app running in the virtual machine
- A list of breakpoints in which you can manage them
[Ctrl]+Click ([Command]+Click on Macs) on a module or function name in the code takes you to its source code - and when you dig into library code this way, you can debug it pretty easily as well.
Is this the Holy Grail of debugging tools? Not really. For Phoenix apps, which is a pretty important part of our lives I would say, the usage of live_reload leads to compilation errors on every code change.
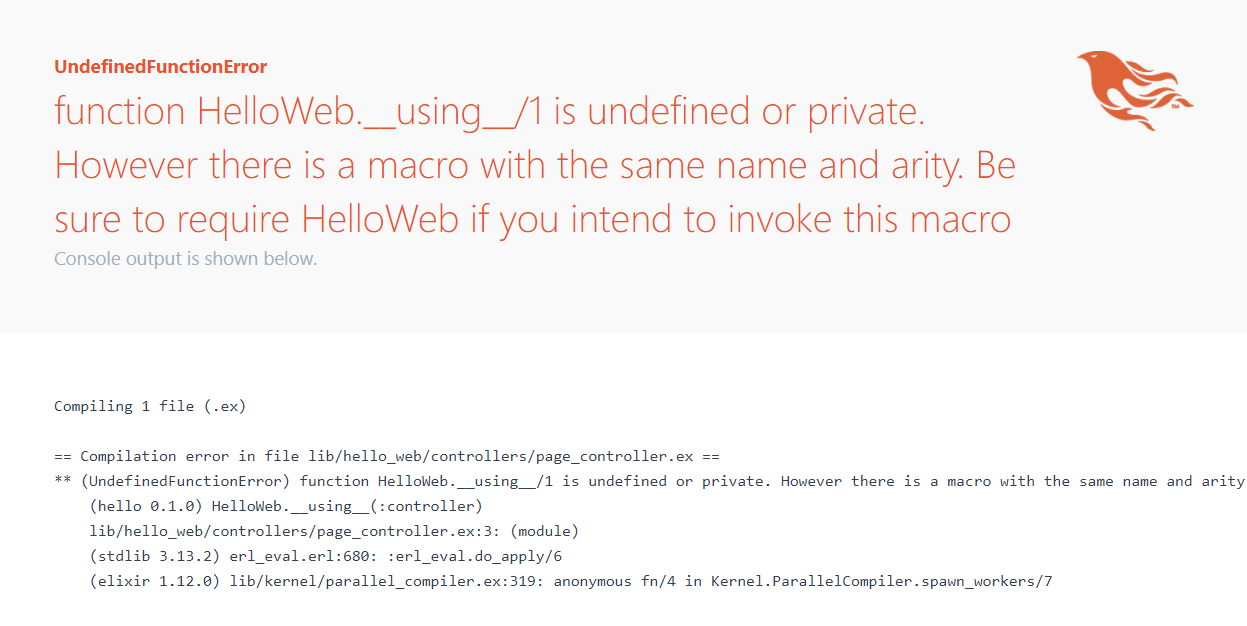
I hope to get to the bottom of it one day and perhaps patch the [ElixirLS debugger](https://curiosum.com/blog/how-easily-synchronize-configuration-visual-studio-code) - but for now the workaround is to disable live reloading when you intend to use it, and revert to manually using the "Reload" button - which is not great, to say the least.
Wrapping up
Elixir isn't the easiest language to debug, and there are several tools you can use - it's good to spend some time trying out them all to ensure you'll choose the right tool for a particular job in the future.
I hope you've found some of my hints on debugging Elixir code useful and regardless of your prior level of expertise in this field it's given you some fresh knowledge!
Want to power your product with Elixir? We’ve got you covered.
Related posts
Dive deeper into this topic with these related posts
You might also like
Discover more content from this category
The choice of technology when creating a web or mobile app is crucial for the entire development plan.
If you've tried integrating Alpine with Phoenix LiveView, you've probably hit at least one of these maddening bugs where everything should work, but mysteriously doesn't. The docs say they play nice together. The examples look simple. Yet here you are, debugging phantom state loss and disappearing DOM elements at 2 AM.
Discover the power of multi-node communication in Elixir with Mika Kalathil. Learn how to connect nodes, manage clusters, and leverage built-in tools for scalable applications.


![Fix Alpine + Phoenix LiveView: 5 Integration Patterns [2025]](https://cdn.prod.website-files.com/6780f4139ab3ae7f7313b0f4/6901b457c96f78ca0a9d7703_Fix%20Alpine%20%2B%20Phoenix%20LiveView_%205%20Integration%20Patterns%20(2025).avif)
